Sketchplanations
Big Ideas Little Pictures

Sketchplanations in a book! I think you'll love Big Ideas Little Pictures

Sketchplanations podcast photo of Rob Bell, Tom Pellereau and Jono Hey

Prefer to listen?
Try the podcast

Like Sketchplanations?
Support me on Patreon

Explaining the world one sketch at a time

Sketchplanations makes complex ideas simple with clear, insightful sketches. Explore topics from science, creativity, psychology, and beyond explained in pictures.

New sketches by email

Learn something new in a sketch each Sunday

Recent sketches

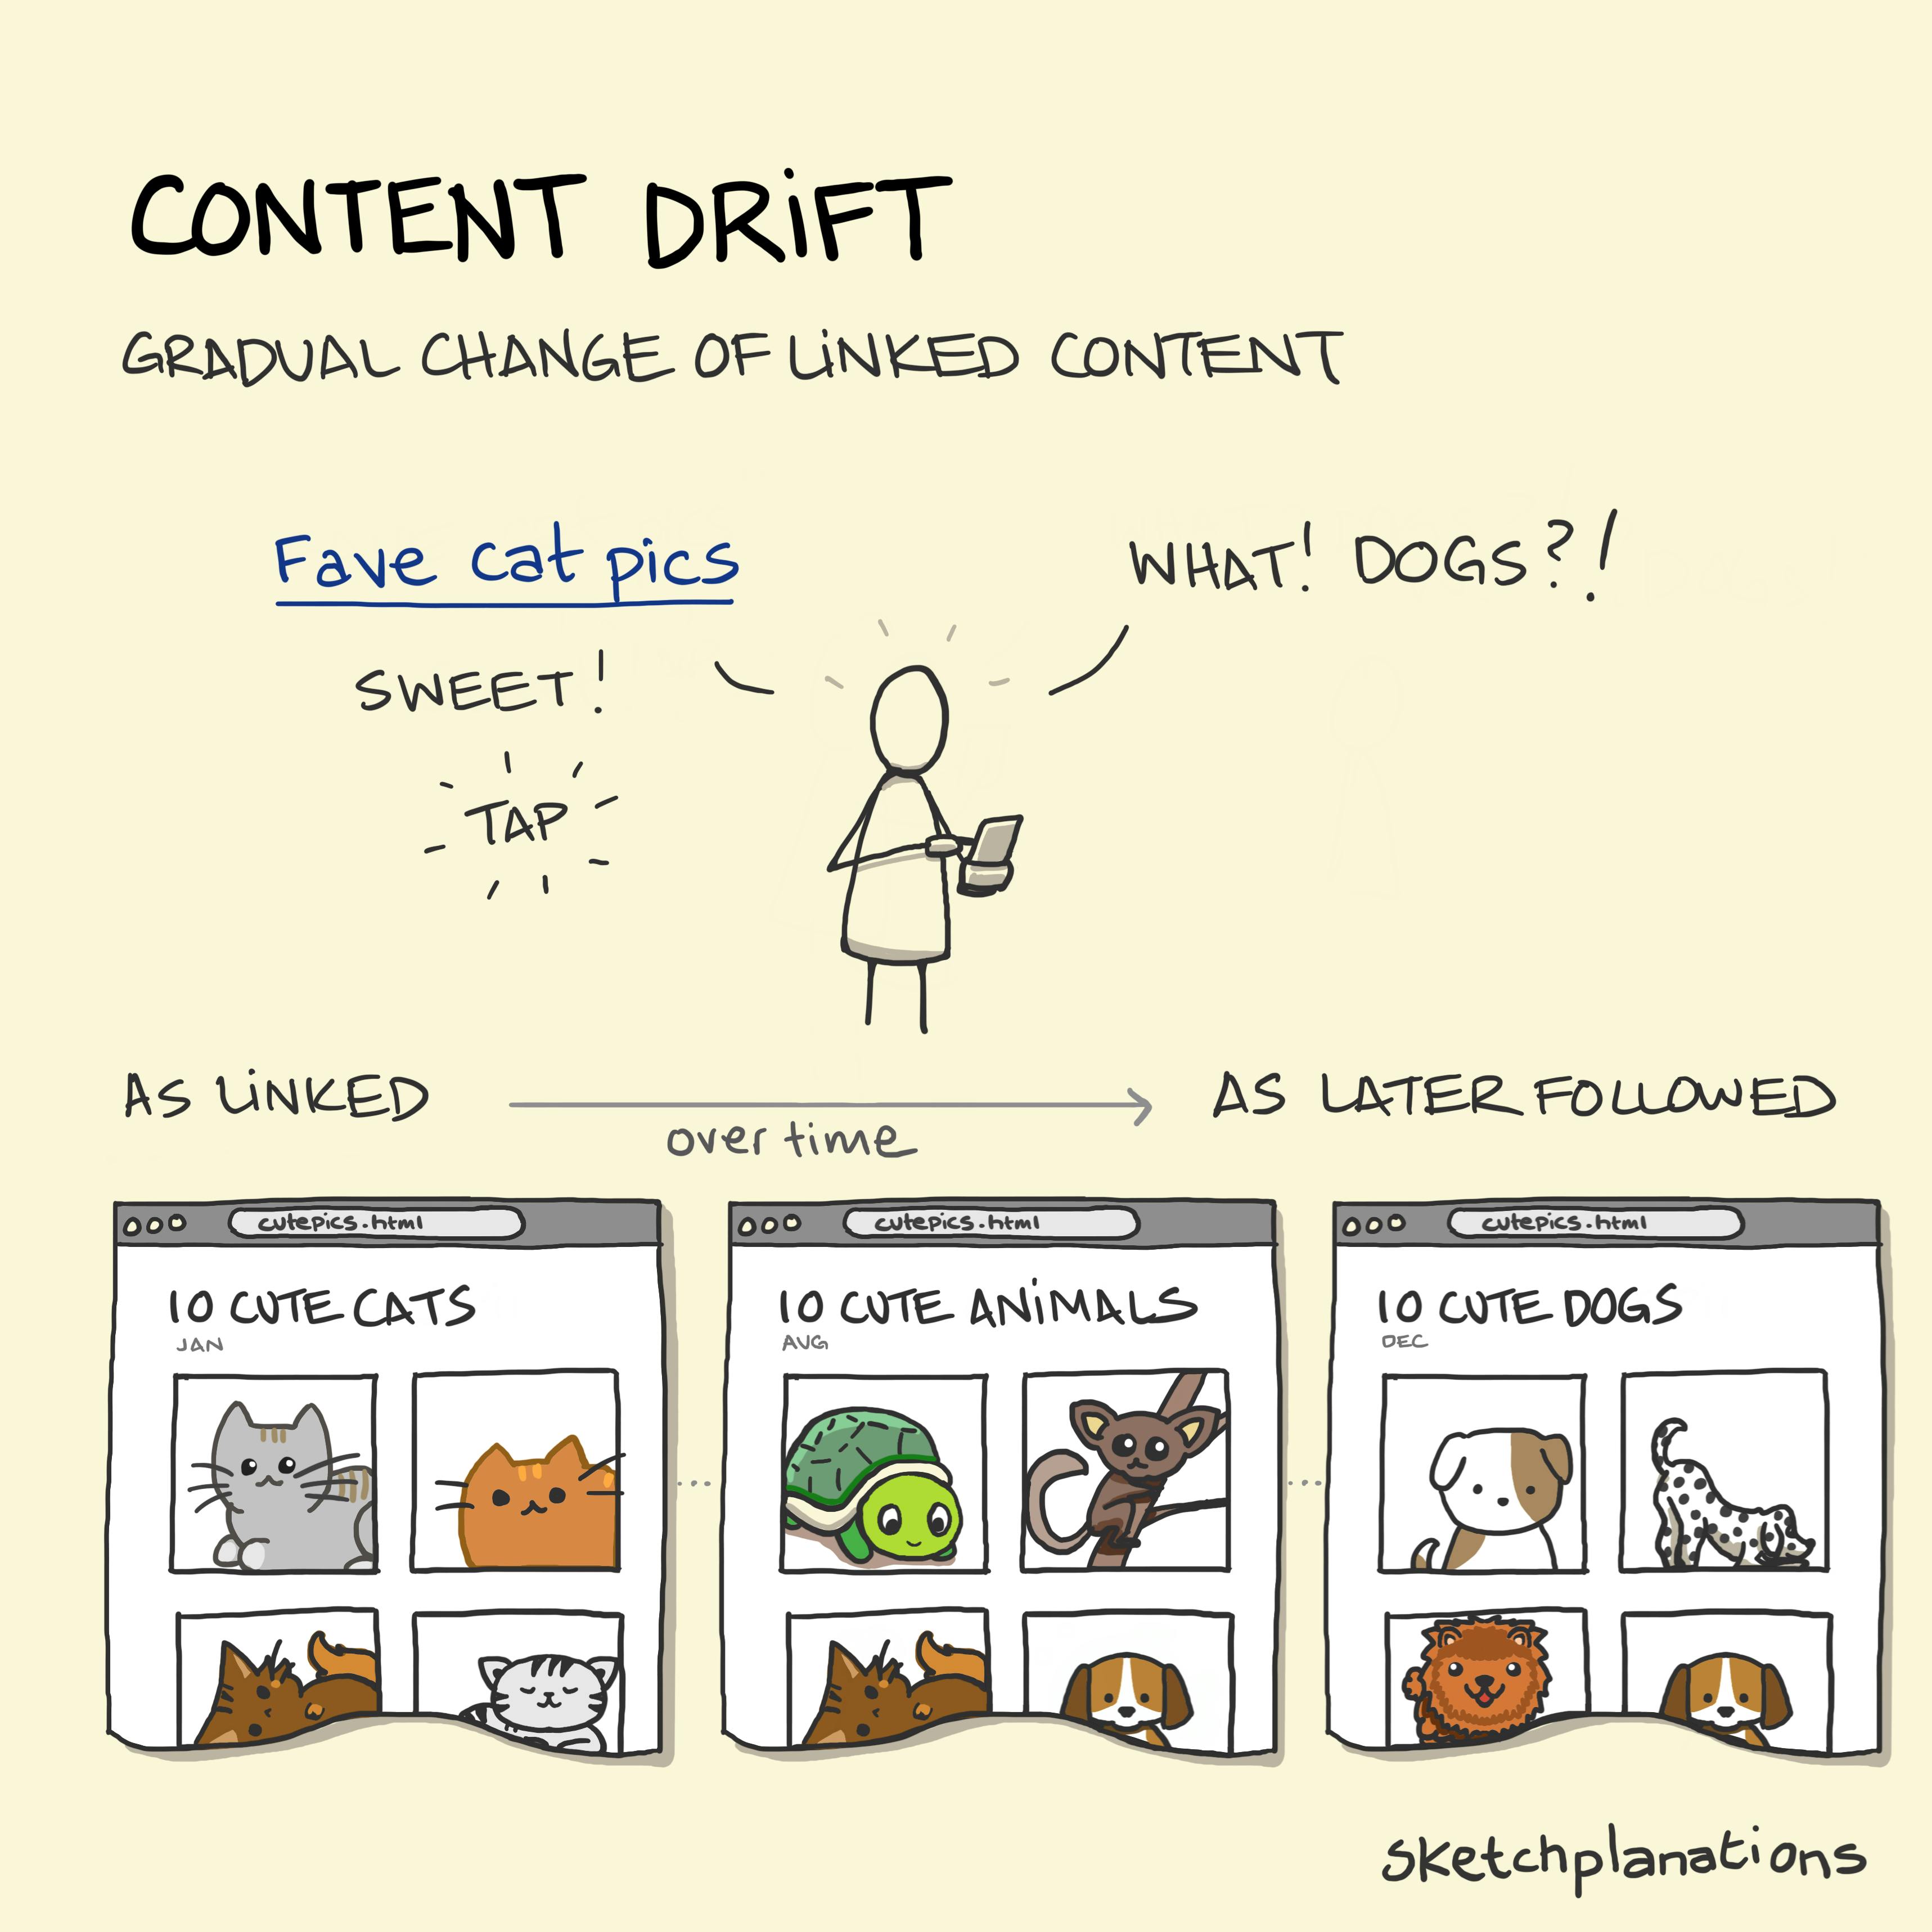
Content drift illustration: A cat-lover is seen on their mobile device, delighted at having linked to an online article containing pictures of cute cats. When they check the same link at a later date, they are confused / annoyed that it now navigates to an article with pictures of cute dogs!

Content drift

Content drift is how a piece of linked content may change over time such that what was once linked may in fact now be very different. An article you link to may be corrected, opinions may be changed, content may be expanded or removed, a paywall may be put in the way, and yet the link keeps steadfastly pointing. Content drift, along with link rot — pages being lost — is one of the ways that the information we have come to rely on on the internet can be gradually undermined. Here's a thread on content drift and link rot from Harvard's Jonathan Zittrain — at least, it was a thread on it when I wrote this. Also see: The Internet is Rotting.
Read more…
Altruism and Ambition Richard Reed quote illustration: a determined character soars through the clouds miles above the earth below and has a large wing strapped to their back. On the left hand side of the wing is a jet engine labelled "Altruism". On the right hand side is a jet engine labelled "Ambition".

Altruism and ambition

The twin engines of altruism and ambition are a powerful force for positive change in the world. They need to be balanced. Ambition without altruism and change may not be positive and altruism without ambition may be nice without impact. But put the two together, for example with a mission-driven business like B-corps, and it can be a recipe for wonderful, positive, and meaningful change — and probably what we need to deal with the challenges of our times. This lovely concept is from Richard Reed, co-founder of Innocent Drinks, and I learned it from Holly Tucker's Conversations of Inspiration podcast. Also see: overnight success, building a plane on the way down
Read more…
Blooms Taxonomy explanation: A series of 6 building blocks are stacked on top of each other, decreasing in size as they go up, creating a pyramid-style construction. Each block represents one of 6 thinking skills. These skills become more sophisticated as the pyramid climbs and reminds us that the foundation of learning is knowledge.

Bloom's Taxonomy

Bloom's taxonomy has 6 levels of increasingly sophisticated thinking skills. It was originally developed in a slightly different form to here for classifying educational objectives and with additional variations, dimensions and sub-levels in the full models, it is useful for informing teaching and learning. The hierarchy reflects, among other things, that a strong foundation for learning is knowledge. The Six Levels in Bloom's Taxonomy The 6 levels in the revised Bloom's Taxonomy for learning are: Remember Understand Apply Analyze Evaluate Create Also see: the learning pit the third teacher zone of proximal development
Read more…
Figuring out the order of operations in a calculation using BODMAS (or PEMDAS)

BODMAS

School mathematics refresher: when faced with a calculation that looks like it could be tackled multiple ways, use BODMAS to help clear it up (See PEMDAS at the end). BODMAS is an acronym (as opposed to an initialism) that tells you the order of operations to tackle in a calculation. BODMAS stands for Brackets, Order/Indices, Division, Multiplication, Addition, and Subtraction. So in 2 + 4 x 2 you don't end up with 6 x 2 = 12 but instead, 2 + 8 = 10 BODMAS is generally built into calculators (you can search 2 + 4 x 2 in Google to see). If you need additions or subtractions to be carried out first you can surround them in brackets eg (2 + 4) x 2 I always learned it as BODMAS, but many people told me they learned this as PEMDAS. The idea is the same just the words are different, and the ordering of Division and Multiplication, which are interchangeable: PEMDAS: Parentheses, Exponents, Multiplication, Division, Addition, and Subtraction
Read more…
Prints and Performances illustration: a black and white artistic representation of the Half Dome rock formation in Yosemite National Park, California. The peak is named for its distinct shape; one side is a sheer face while the other three sides are smooth and round, making it appear like a dome cut in half. The image is accompanied by a quote from celebrated American photographer, Ansel Adams.

Prints and performances

"This negative is the score. The print is the performance." This memorable analogy is from Ansel Adams, one of the foremost American photographers. From the negative captured by the camera, Ansel would experiment with cropping, dodging and burning (lightening and darkening) to create the final print. We have a large print of moon and half dome in our hallway. It reminds me that what the camera captured directly isn't the final piece. You still have the performance to perform. The analogy works beyond photographs. A recipe, a script, a joke, or a business idea all still need the right performance.
Read more…
Gini Coefficient illustration: a scale of wealth distribution is depicted where green squares represent the wealth of an individual within a population. On the left, every individual has a green square - equal wealth distribution. In the middle, the wealth sits with only half the population. On the right, all the wealth sits with only one person - they have a shiny crown and gold chain to display that wealth!

The Gini coefficient

The Gini coefficient, or Gini index, is a common way to gauge income or wealth inequality within a population. The coefficient gives a single number showing how equal a distribution is. For example, in a population where everyone earns the same amount the Gini coefficient would be 0 — total equality — and in a population where one person earned all of the population's money, the Gini coefficient would be 1 (sometimes expressed as 100%) — maximum inequality. In practice all countries' Gini coefficients are somewhere in between, at around 0.25 to 0.5 after taxes. Like any simple measure the Gini has its difficulties, like being easily misinterpreted when compared, but is still widely used. The BBC has a short piece on its history and an alternative measure called the Palma ratio. Of course, we have some high profile zillionaires at the moment. You might like this old sketch of wealth inequality in America. Order print
Read more…
Buy Me A Coffee